Debugging Tools
When troubleshooting a complex node setup, it is often a matter of checking whether and, if so, which values are exchanged between the nodes. Are the data types correct and are the passed values within the expected range for subsequent calculations?
To simplify these steps, various functions are available to read data types and values directly at ports.
Info Box
 The info box displays information about selected nodes and ports directly in the node editor.
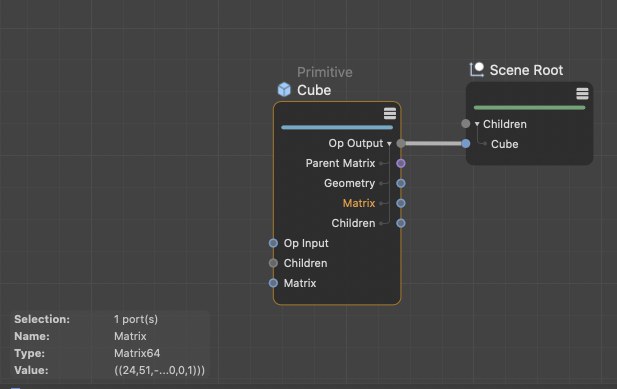
The most obvious option is a grayed out area at the bottom left of the Node Editor. Here you can read the name of a selected node and if necessary also the type of the node or asset. If a port is selected on the node, its data type and often its value can also be read here. Since with more complex data types, e.g. vectors or matrices, several numerical values are transferred at the same time, the space for the complete representation of all values in the info area can become scarce. In this case, you can right-click on the displayed value and have the values copied to the clipboard. When pasting e.g. into the comment area of the node, all numerical values can then be read off.
Data Inspector
 The data types and values of selected ports can be displayed in a separate Data Inspector.
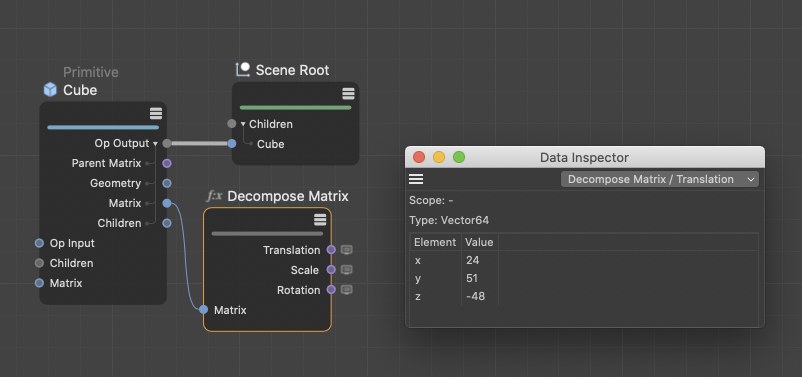
The second option circumvents this space problem when displaying larger amounts of data. To do this, right-click on a port and select "Data Inspector" from the context menu. A separate window opens, in which the data type and also the values present at the port can be read. To keep track of the port from which the values are displayed, a small dialog icon also appears next to the port. It is also possible to display the values of several ports on one node in the inspector. The inspector has its own drop-down menu in the header, where you can choose between the different marked ports. The evaluation of the port values for the inspector can be stopped by right-clicking on a read port and selecting "Data Inspector" again.
Port Inspector
 The values of selected ports can also be displayed directly next to the ports.
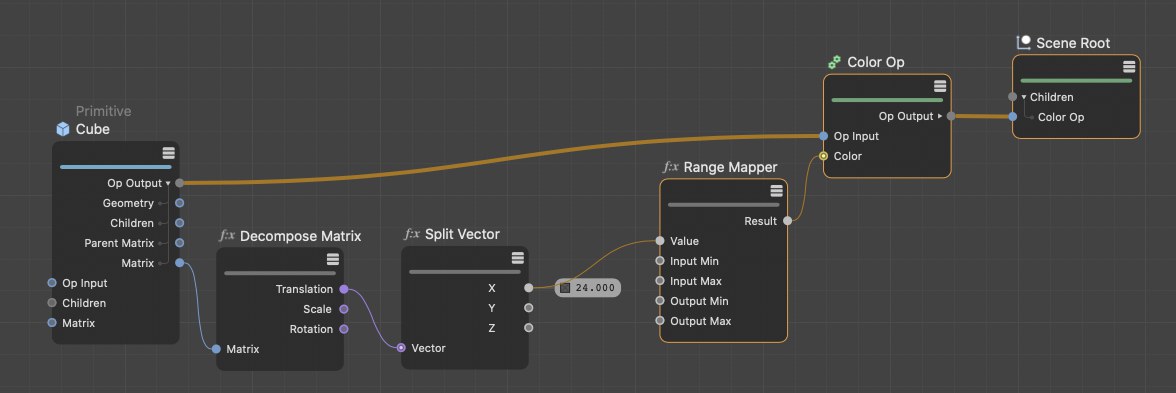
The third and most direct option for viewing port values can also be activated after right-clicking on a port. To do this, right-click on the port and this time select the "Port Inspector" in the context menu. The value of the port can now be read directly in a field next to the port. This works even for more extensive data types, such as vectors, matrices and colors. Via the described context menu you can deactivate the display of the value at the port at any time again.