The Motion Tracker Graph
![]()
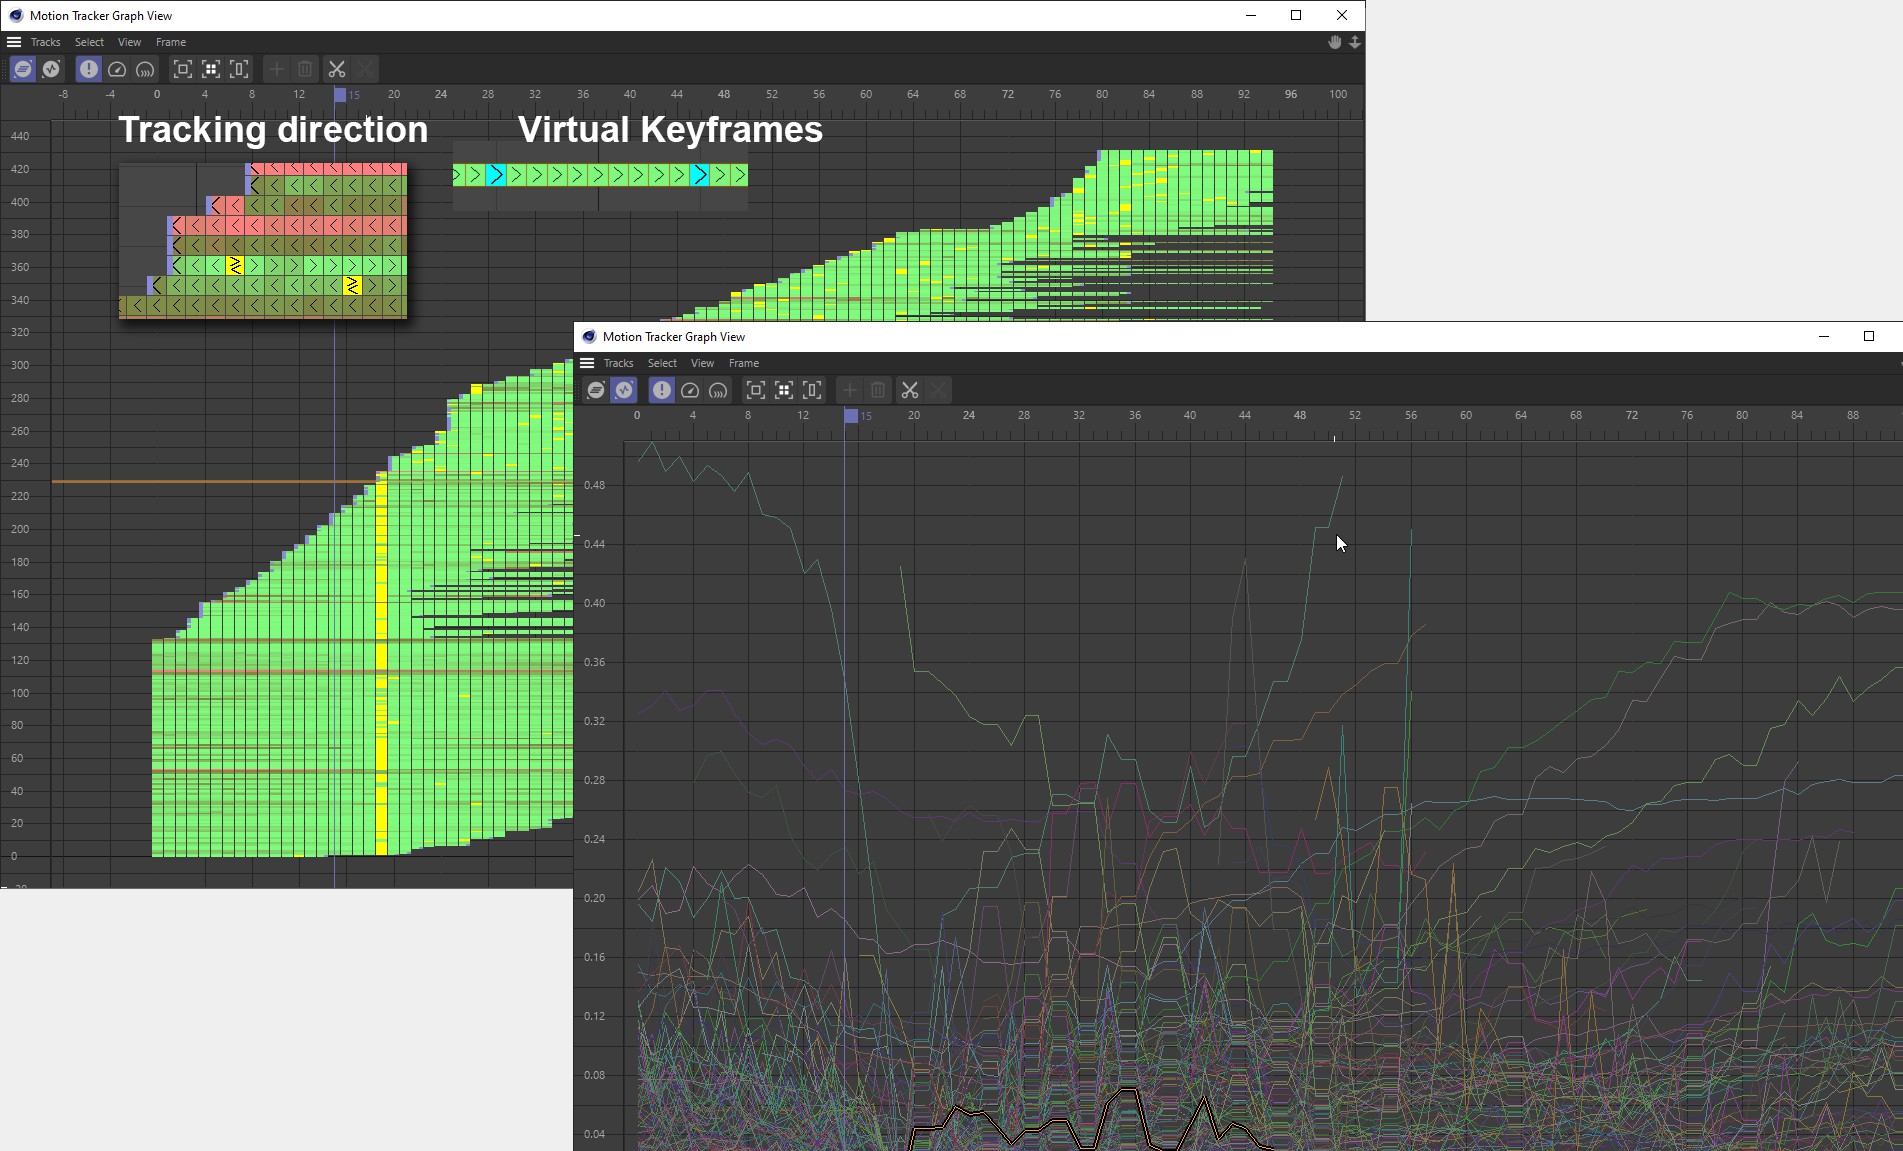 2 incarnations of the Motion Tracker Graph (left: Top-Down mode; right: Graph mode).
The Motion Tracker Graph (referred to in the following as Graph) is an assistant that provides a visual impression about the quality of both the Auto Tracks and the User Tracks. Imagine the Graph as a simple timeline (but you can only add or delete - but not move - keys) in which Tracks are listed temporally. They are sorted primarily according to their start time and secondarily according to their end time. Note that filtered Auto Tracks will not be displayed.
Normally, bad Tracks (see also What are good and bad Tracks?) are not easily recognizable in the editor unless they are extremely bad. The Graph shows the relative (!) quality in the default 2D Tracking Errors view as follows:
- In Top-Down Mode: Green regions = better quality; red regions = poor quality. The transition is stepless from green to brown to red. Other colors you will see: yellow (key), gray (shortened Track) and blue, turquoise, purple (filtered Track (due to: smart acceleration, max. acceleration, error threshold), suppressed regions can be found beyond the marks).
- In Graph Mode: The greater the graph's distance from the X axis the poorer the quality of the respective region.
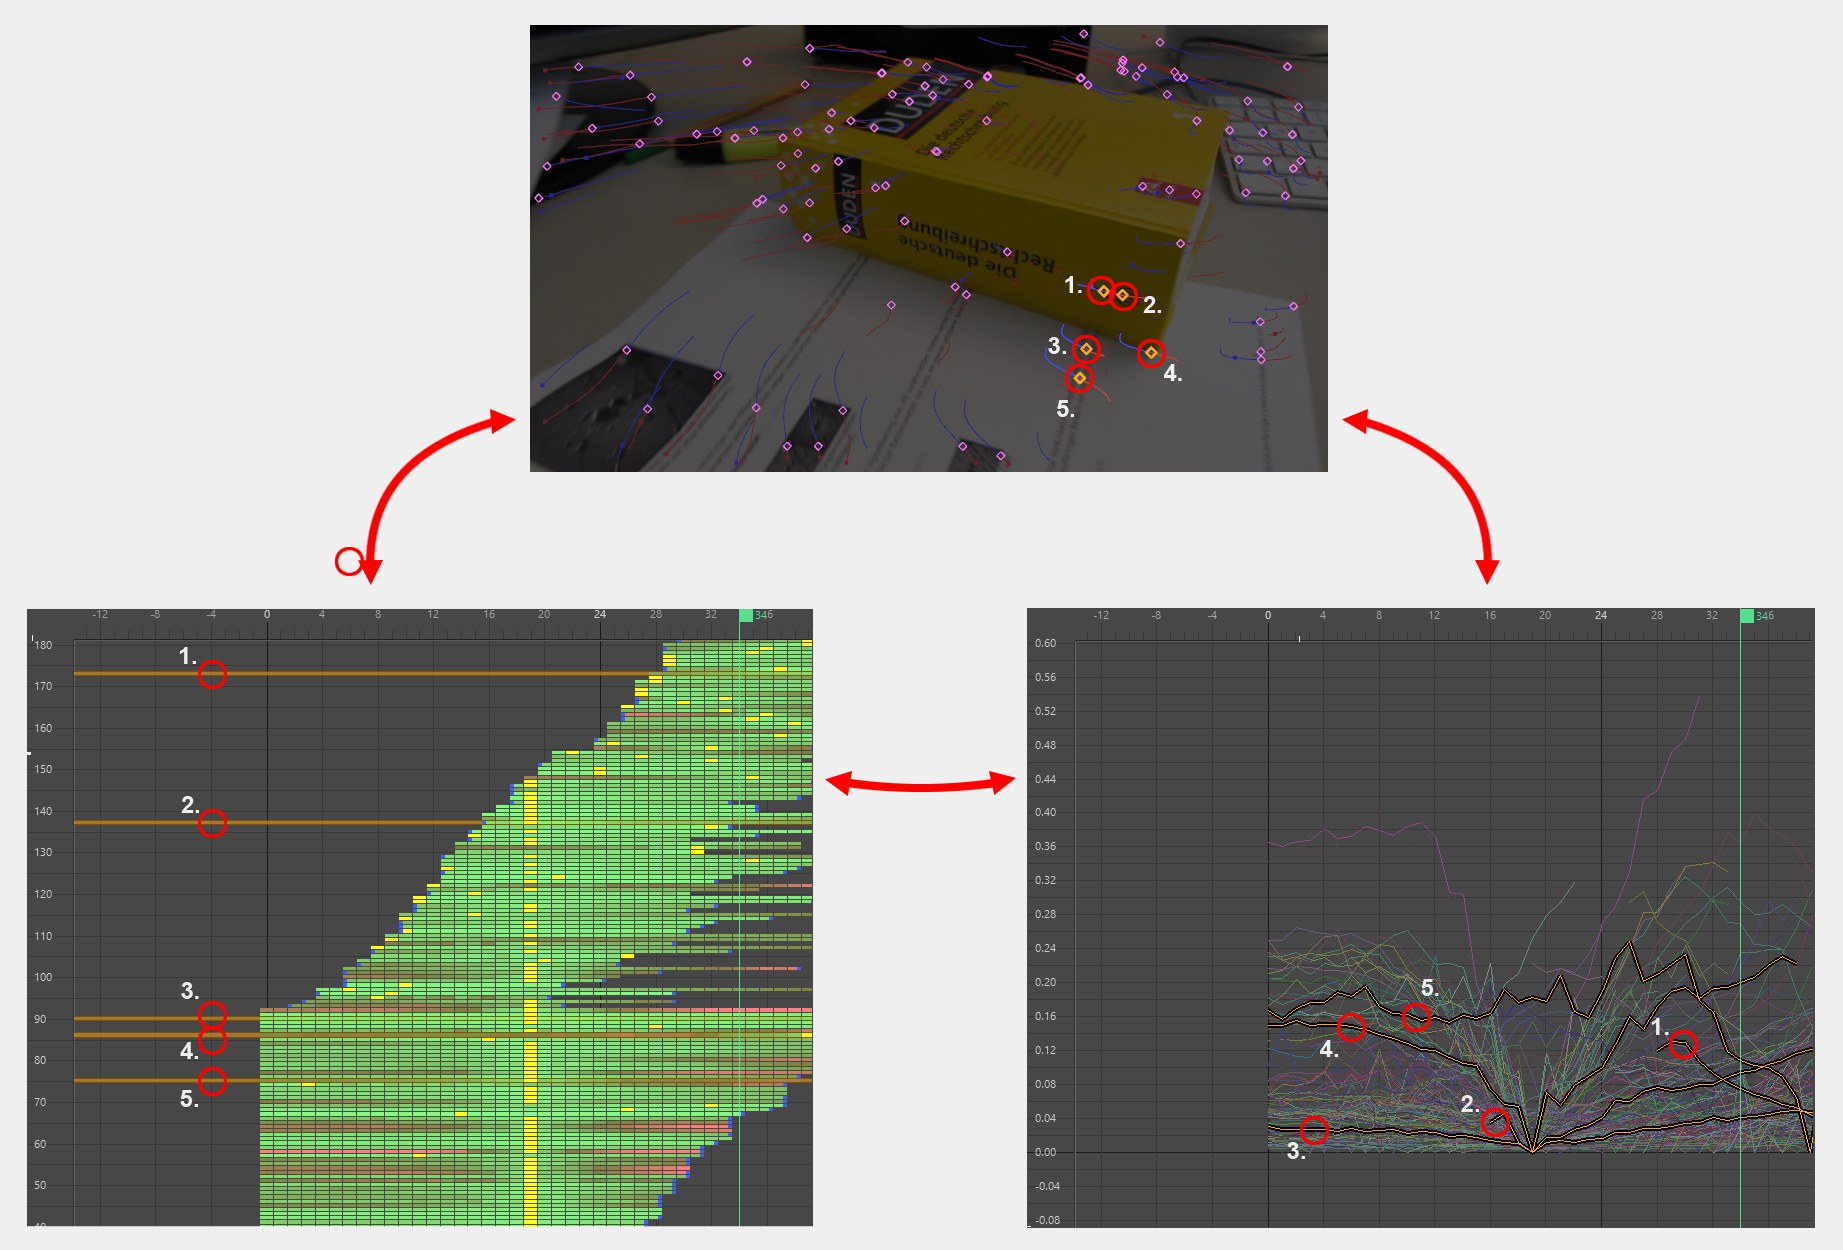
This does not necessarily mean that red Tracks (or graphs that lie far from the X axis) are bad. It only means that these Tracks have the greatest number of faults compared to the remaining Tracks (see ![]() 2D Tracking Errors). The Tracks can still work fine.
2D Tracking Errors). The Tracks can still work fine.
If your 3D reconstruction doesn't work and you have to fine-tune Tracks, red Tracks/high graphs can offer an indication of which Tracks or regions may be problematic. Simply check the red Tracks/high graphs to see if they match the footage. "Rogue" graphs can also be easily recognized in 2D Tracking Speed and 2D Tracking Acceleration modes - but not (!) via a red coloring but by the fact that they diverge from the remaining graphs.
Use
At the top right of each window you will find the already familiar icons for zooming and moving within the view. Alternatively you can use the hotkeys 1 or Alt+MMB (move) or 2 or Alt+RMB (zoom) to navigate.
The green animation slider can be used to navigate through the animation. The slider marks the current location, which, for example, can be used to access commands in the Tracks menu. If you place the cursor over a key or a filter marker, corresponding information will be displayed.
Each selected Track in the editor will also be selected in the Graph and vice-versa.
 Track selections are always synchronized.
Tracks can be selected in the Graph using the usual methods, i.e., clicking on them or dragging a selection box. The Shift and Ctrl/Cmd keys can be used in their usual manner: Tracks will be added or removed from the selection. Clicking in an empty area will deselect all.
Only complete Track graphs can be selected.
So what can be done with Tracks when they've been selected? They can be isolated using the Select menu's options, which lets you modify only these Tracks (see Tracks after 2D Tracking). Other interactive behavior in the Graph is restricted to adding and deleting keys and the shortening of Tracks. Selected Tracks can be deleted via Del/Backspace keys.
These are all functions that you should be familiar with from working in the editor (see also Tracker menu).
Note the context menu, which offers a list of familiar commands (see also Tracker menu).
The Motion Tracker Graph menu
Note that several of the commands listed in this menu - namely all of those listed under Tracks or Select - are already listed in the main Tracker menu and are also described in that section.
View
Use this setting to define how finely and detailed the grid in the window's background should be displayed.
If you look closely, you will sometimes see colored markers at the start and end of Tracks when in Top-Down Mode. This option can be used to show or hide these markers. This also affects the visibility of the filter type for keys and the markers.
This default mode lists all Tracks in temporal order. The order is as follows: The Tracks will be sorted primarily according to start time and secondarily according to end time from bottom (y=0) to top, i.e., Tracks that appear first will be arranged at the bottom and Tracks that come later will be arranged accordingly towards the top. This means that Tracks that were edited can suddenly be arranged differently. We recommend isolating the Tracks you want to edit (Select menu).
In this mode you have a better overview over the number of Tracks, length of Tracks, Tracks per frame, etc.
When in Graph Mode, all Tracks (which will be displayed below) will be displayed as graphs, whereby the values in the menu at the bottom will be applied to the Y axis. When in this mode it is especially easy to determine which graphs deviate the most.
In this default mode, each Track's errors will be displayed.
An ,error’ in this case is a mathematical value that represents the current deviation of the Track from the image detail saved in the foregoing keyframe (detailed information about Tracks can be found here).
Take a look at the following, quite typical, Track:
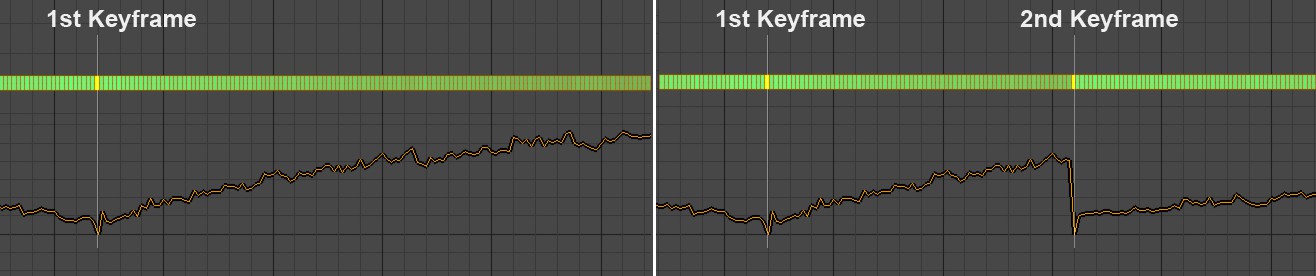 The course of a typical Track. At left with one keyframe, at right with a subsequently added second keyframe.
The error for one keyframe is zero - which is because there are no deviations at that location. However, the farther from the keyframe the graph is, the greater the error (=deviation from the image detail saved in the key) will be that changes with each frame. If a second keyframe is added, the error at that location will again be zero and again increase as the graph continues. Hence, you can suppress an error by adding keys (or fine-tuning existing keys).
In Top-Down Mode, each error will be displayed in color for each image, as described here.
This mode displays the velocity of the Tracks in the editor. This view works best in Graph Mode.
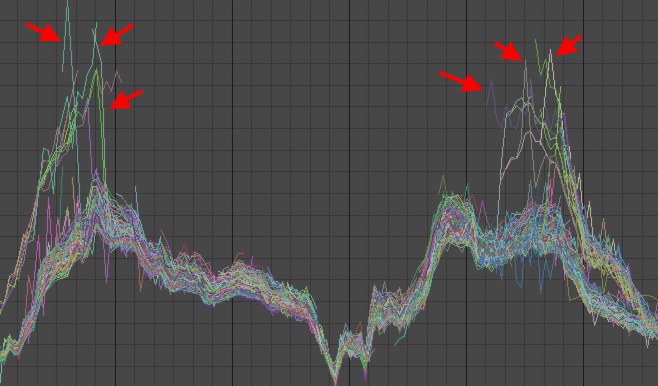
Graphs all run more-or-less ,parallel’. We'll use a camera movement as an example: If the camera pans with a high velocity, the Tracks will move correspondingly fast and the graphs will be positioned correspondingly high at that location. If individual tracks deviate greatly from the rest (as shown in the image) then these are most likely faulty.
The Tracks will be colored according to their velocity in Top-Down Mode: green=fastest; red=slowest.
This mode displays the acceleration of the Tracks in the editor. This view works best in Graph Mode.
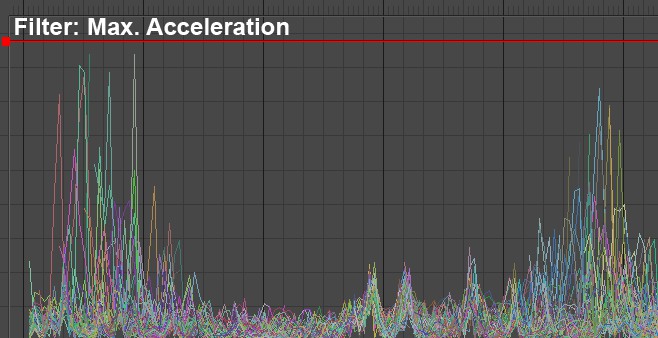
This view lets you locate individual Tracks that have a high velocity (i.e., Tracks that jump). These are almost always faulty. If the Motion Tracker object's Maximum Acceleration option is enabled (2D Tracking tab), this threshold value will be displayed here. This value corresponds to the filter setting, which means that it can be moved vertically to filter out deviate graphs.
The Tracks will be colored according to their velocity in Top-Down Mode: green=fastest; red=slowest.
Navigation
This is the command that you will probably call up right after opening the Motion Tracker Graph - it lets you zoom and move all visible Tracks so they fill the window completely.
This command zooms and moves all selected Tracks so they fill the window completely.
Adjusts the view so the Timeslider is in the center.