Overview
The debugging tools
When troubleshooting a complex circuit, it is often necessary to check whether and, if so, which values are exchanged between the Nodes. Are the data types correct and are the transferred values within the expected range for subsequent calculations?
To simplify these work steps, various functions are available to read data types and values at ports directly.
The info box
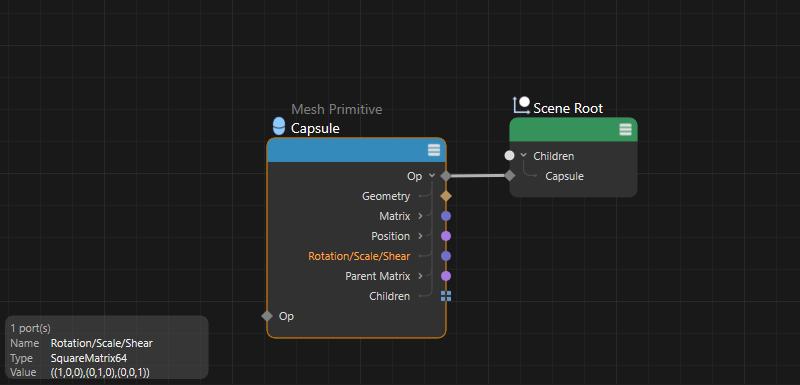 The info box displays information on selected Nodes and ports directly in the Node Editor.
The most obvious option is a grayed-out area at the bottom left of the Node Editor. Here you can see the name of a selected Node and, if applicable, the type of Node or asset. If a port is selected on the Node, its data type and often its value can also be read here. As more complex data types, such as vectors or matrices, transfer several numerical values at the same time, the space for the complete display of all values in the info area can be limited. Therefore, the info area can also be scaled by dragging its right edge with the mouse. You can also right-click on the displayed value and copy the values to the clipboard. All numerical values can then be read off when inserting them into the comment area of the Node, for example.
The Data Inspector
 The data types and values of selected ports can be displayed in a separate Data Inspector. This can be opened, for example, by dragging a port into an empty area and selecting Data inspector (shown in the image on the left).
The second option avoids this space problem when displaying large amounts of data. To do this, right-click on a port and select Data inspector from the context menu. You can also simply draw a connecting line from a port into an empty area of the Node Editor. After releasing the mouse, a context menu also opens, via which the Data Inspector can be selected. The Data Inspector can also be opened directly via the Debug menu of the Node Editor.
A separate window opens in which the data type and the values present at the port can be read. To keep track of the port from which the values are displayed, a small dialog icon appears next to the port (shown on the right-hand side of the image above). You can also easily display the values of several ports on one Node in the inspector. This has its own drop-down menu in the header, where you can choose between the different ports. The evaluation of the port values for the inspector can be ended by right-clicking on a read port and selecting Data inspector again. The trash can icon can also be clicked directly in the Data Inspector to remove the currently displayed port data from the display. However, it is often even quicker to click on the X symbol on the icon next to the respective port. This can also be used to switch off the transmission of the relevant port values to the Data Inspector. You will also find the Remove all Data Inspectors command in the Debug menu of the Node Editor, which can be used to remove all ports of the circuit from the Data Inspector.
Interactive mode
It can often be helpful to take a quick look at the data supplied for a port. It is not necessary to establish a fixed connection between the port and the Data Inspector, as it also offers an interactive mode that you can activate via the square icon in its header (third icon from the right).
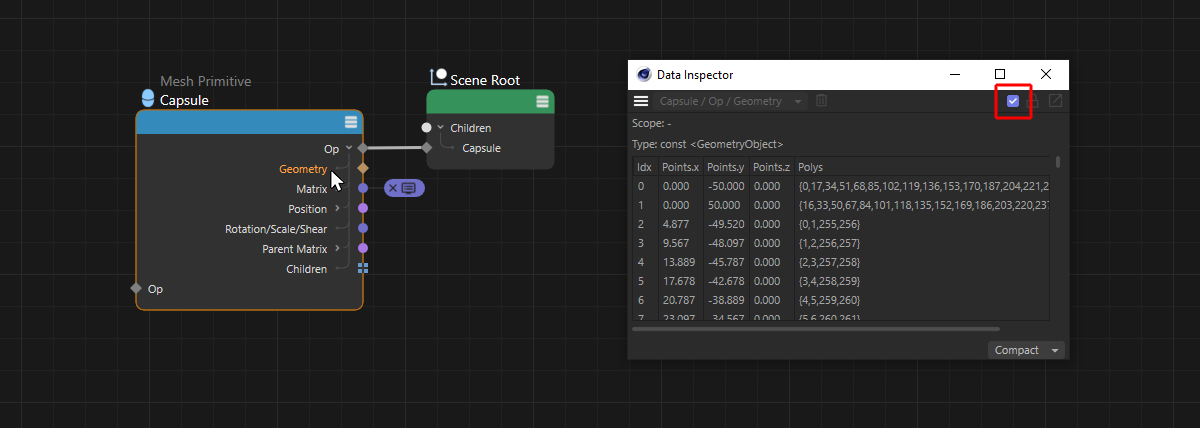 After activating the interactive mode in the Data Inspector, only the data of the currently selected port is displayed.
As can be seen in the image above, existing port markings for the Data Inspector are ignored in this mode and the toggle menu for the marked ports in the header area of the Data Inspector is deactivated. Only the data of the currently selected port is displayed. All you need to do is click on the name of an Output port. In the image above, for example, the geometry data of a capsule base object is output.
If additional values from selected ports are to be output, an additional Data Inspector can be called up, e.g., via the Debug menu of the Node Editor.
Compact/Manual mode
Some data structures can be very complex. Think, for example, of the geometry information, which must manage both the point coordinates and the point numbers to be connected to lines and polygons. In addition, a geometry often contains UV coordinates or selections that are also saved in this data format. The Data Inspector offers additional modes for displaying such data types. You will then find the corresponding switching option at the bottom of the inspector:
- Compact mode: This is the standard mode in which only the most important information from the selected data set is displayed. For geometry data, for example, these are the point coordinates and the indices of the polygons connected to these points.
- Manual mode: Here you can choose which data you want to see. In the case of geometry, for example, this also includes the various selections on the object. The data to be displayed is selected via the menu at the bottom of the inspector (see illustration below).
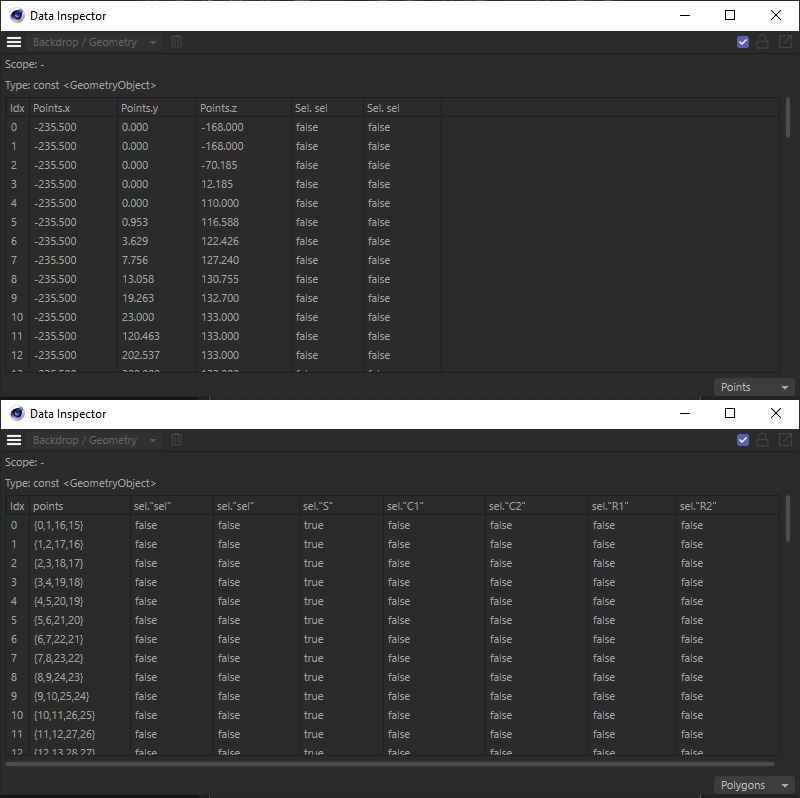 The desired data can be selected from a drop-down menu at the bottom of the inspector. For example, the illustration shows the data of a geometry output. Individual point coordinates were selected at the top and the point numbers of the polygons below for the output. Information about saved selections of the corresponding element type is also output automatically. The UV coordinates, for example, can also be displayed in the same way.
The Port Inspector
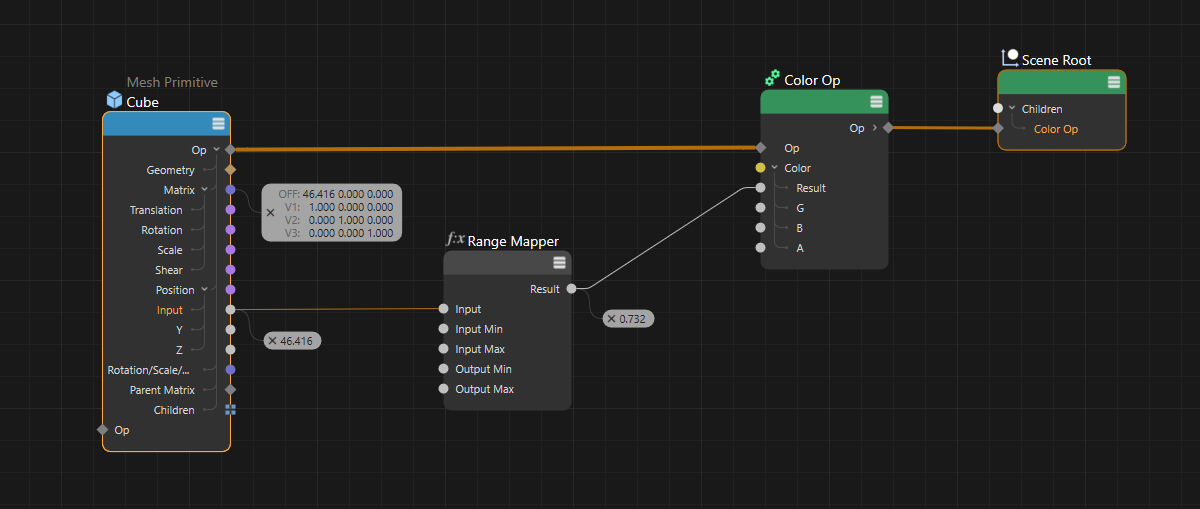 The values of selected ports can also be displayed directly next to the ports.
The third and most direct option for displaying port values can also be activated by right-clicking on a port. To do this, right-click on the relevant port again and this time select the Port Inspector in the context menu. Alternatively, you can also draw a connection line from a port and drop it in the empty space of the Node Editor. A context menu also appears here, which you can use to display the Port Inspector for this port.
The value of the port can now be read directly in a field next to the port. This even works for more extensive data types, such as vectors, matrices and colors. You can deactivate the display of the value at the port at any time via the context menu described above, or you can simply click on the X symbol, which can be seen on the left-hand side of the displayed values.
Please note, however, that not all ports of a Node can always provide values. This is because Nodes are often only calculated if their output also leads to other Nodes and contributes to the result forwarded to the Scene Node within the circuit. However, the Port Inspector still provides helpful information in such cases, as the following section shows.
Special outputs on the Port Inspector
Even if ports or Nodes do not yet play an active role within a circuit, valuable information can be read via the Port Inspector. The following illustration provides a simple example.
 Different outputs for two unused geometry ports within a capsule.
As can be seen in the illustration above, a Node mesh was dragged into the Object Manager as a capsule and an Object link was added to the capsule as a user data record(here you will find all information and examples on the use of user data on assets and Node groups). This makes it possible to assign an object directly via the Attribute Manager, whose geometry, color, name or matrix can then be queried within the capsule via corresponding inputs, for example.
However, as long as no object has been assigned in the corresponding link field on the capsule, the associated input ports cannot yet provide any data. The Port Inspector indicates this with the term nullptr. This always means that the corresponding port cannot process any data and therefore cannot deliver a result.
All Nodes connected to such a port will therefore also not be able to be calculated.
The Cube Node, which was also created in the capsule and also offers a Geometry output, is completely different. The Port Inspector shows the term Not active. This means that this Node can be calculated, but the port only receives the result when its output contributes to the result of the circuit. Such ports can therefore also be connected to other Nodes without any problems and become active the moment the corresponding Node strand is connected to the scene Node.
 Depending on the activation at the Switch Node, either the upper or the lower geometry is activated and passed through.
The console edition
All of the above functions have the disadvantage that only current values are displayed. The development of a value, e.g., whether it increases or decreases during the animation, cannot be tracked directly in this way. In these cases, values can also be sent to the console, where they are displayed in a continuous list. To do this, a Console Output Node must be integrated into an existing connection. The passed-through value then appears automatically in the Console. The Console is automatically included in the Cinema 4D Node layout. Otherwise, it can also be opened directly via the Cinema 4D Extensions menu at any time.
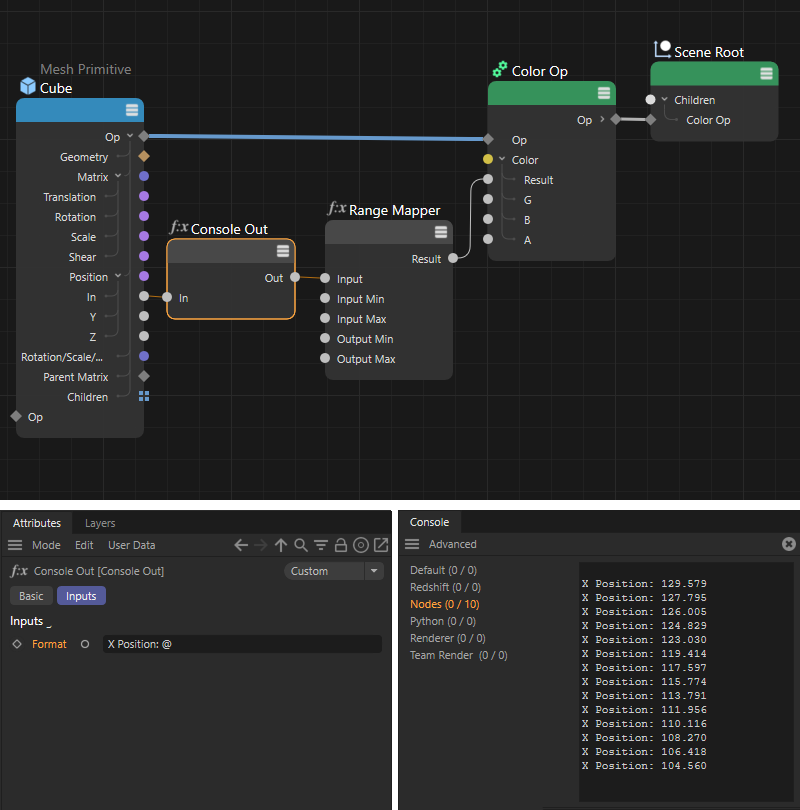 The Console output sends passed values as strings to the console.
Further information on the console can be found in this section. The complete explanation of the Console Output Node can also be found here.
The heat map
When it comes to complex Node circuits or the creation of asset capsules, it can be helpful to optimize the performance of a circuit. For this to be possible at all, we need a tool that can display the calculation time of each Node within the circuit. This is exactly what a heat map is.
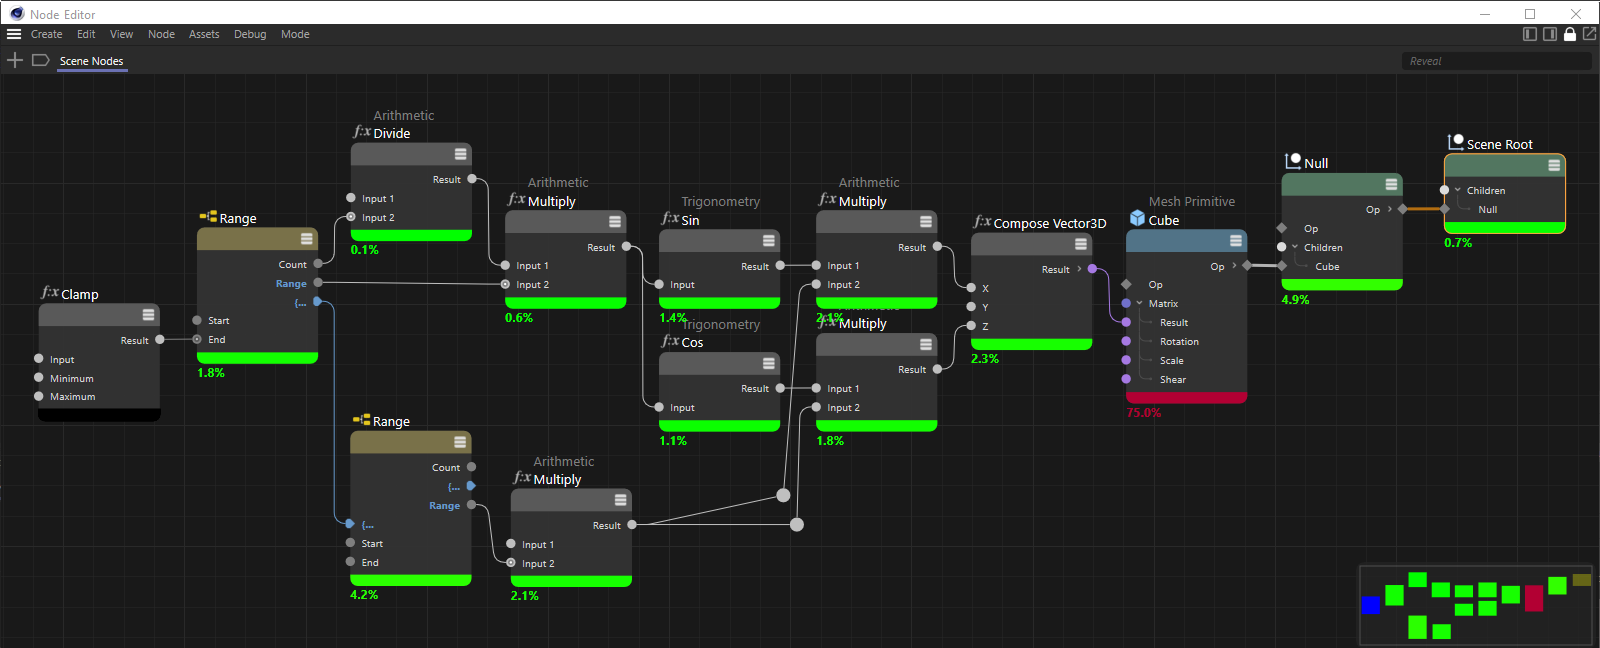 Activating the Heat Map will cause the Nodes to be highlighted and a percent value to be displayed beneath each Node.
To activate the heat map, call up the command of the same name in the Debug menu of the Node Editor. This is followed by a color change at the bottom of all Nodes, which allows you to see the relative computing requirements of the Node within an update cycle of the circuit. By default, the colors vary from blue and green, as a marker for simple Nodes that can be calculated very quickly, to yellow and orange for gradually more complex calculations. The color red is reserved for the Nodes that require the most time. Black coloring is provided by default for the Nodes that either have no active connections to the rest of the circuit or perform static calculations that only need to be carried out once. In the illustration above, you can recognize this, for example, by the Clamp Node. The entered value is only checked once and then output unchanged for all subsequent calculation cycles of the circuit. Continuous recalculation of such Nodes is not necessary, as they are regarded as static.
If you prefer a different color scheme for marking the calculation times of the Nodes, you will find the corresponding settings in the Preferences and their Node Editor section.
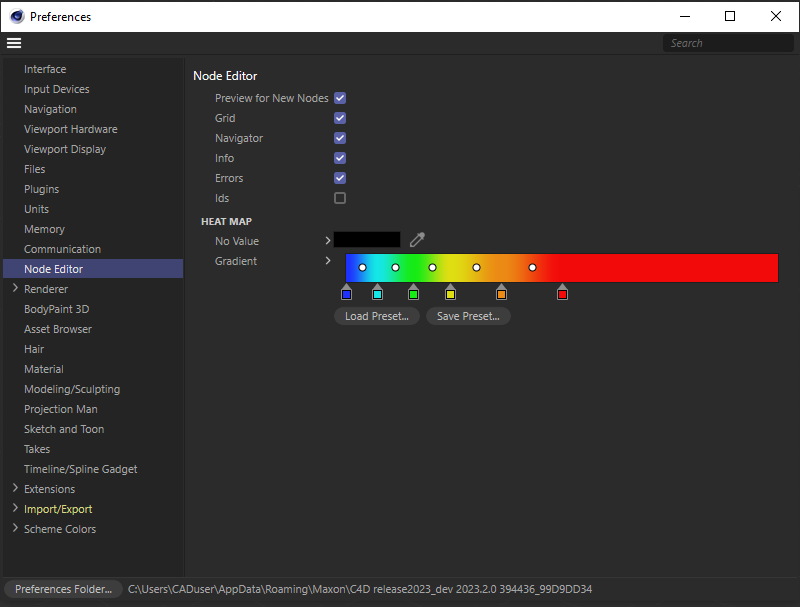 The color marking of the Nodes during the heatmap evaluation can be set individually via a Fab gradient and a separate color value for static Nodes in the program settings.
In addition to the colors, percentage values are also displayed at the bottom of the Nodes, which indicate the computing requirements of the Node in relation to the overall circuit or in relation to the Nodes within the same path depth. You can make this distinction using the Heat Map Relative mode option, which can also be found in the Debug menu. The following illustration clearly shows the effect of this option.
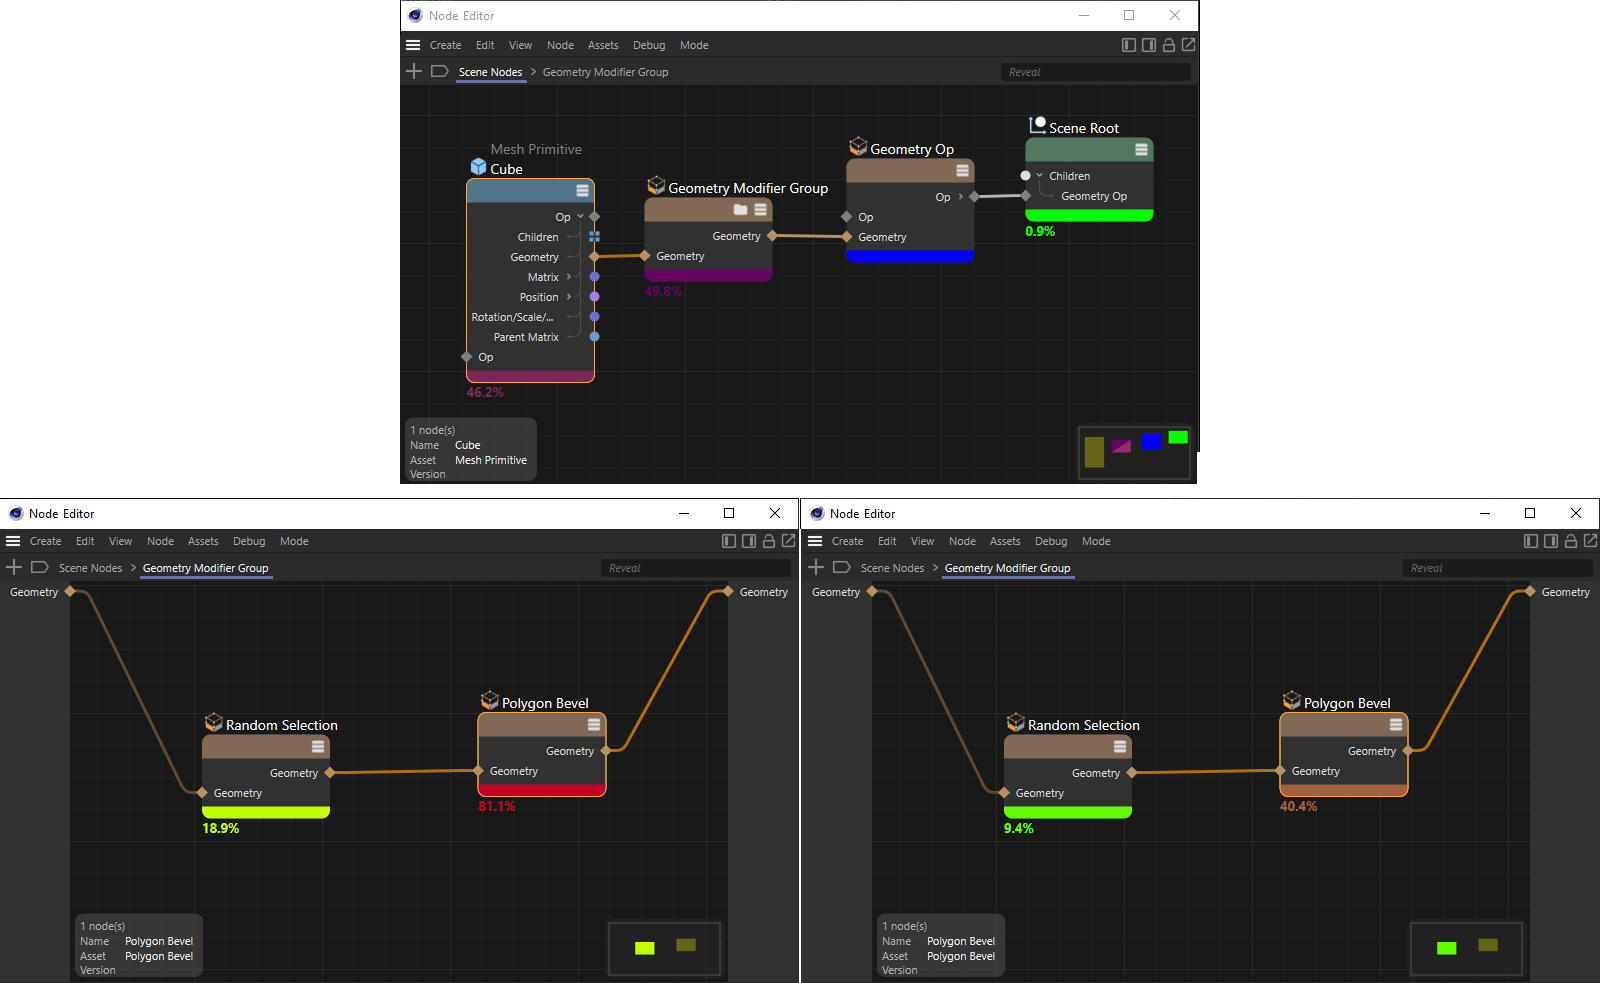 Depending on the relative or absolute evaluation of the heat map, different percentage values appear for the Nodes that are used in groups.
In the upper area you can see the main circuit, in which a group is also used(geometry modification group). In this main level of the circuit, it does not matter whether the relative mode of the heat map is active or not. The displayed percentage values always add up to 100% and thus show the percentage share of each Node or group in the overall circuit. However, if you open a group and move down a level within the Node path, the difference becomes clear (see lower half of the image).
At the bottom left you can see the relative mode that is active by default. The heat map values of the Nodes within the group also add up to 100% again. The values are therefore only related to the currently visible Node level. The image on the bottom right shows the result with relative mode switched off. The percentage values are calculated in the context of the overall circuit, i.e., in absolute terms, and thus add up to the value that we could already read off the group in the total of the circuit.
Evaluating the heat map
The colors and percentage values already give an indication of which elements of the circuit take up the majority of the calculation time. However, this must be seen in context. A Primitive Node may be marked red in the circuit, for example, but it can be calculated quickly and cannot be replaced by other Nodes. So there is no need for optimization here. The absolute time required for the calculation is the most important factor. We can display this data as text in the Console using the Print heat map command. The heat map does not necessarily have to be active for this.
If the Node layout is used, the Console is already visible in the layout. Otherwise, you can open the Console window via the Window menu. The following image shows an example output of the heat map data there.
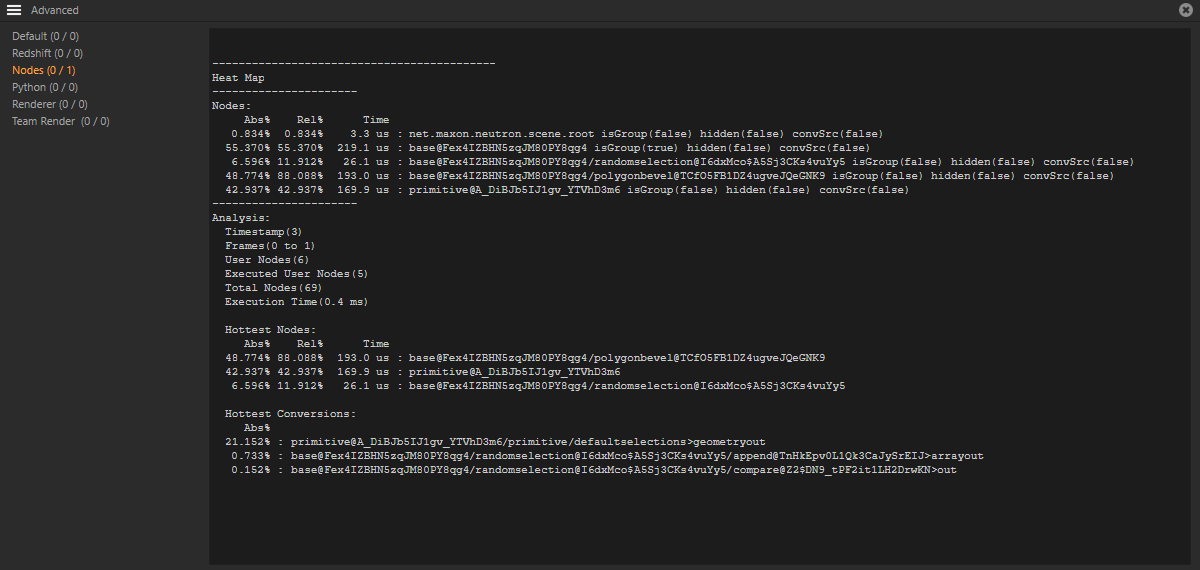 Example for the output of heat map data in the console.
The output in the Nodes area of the Console is divided into four sections:
- Nodes
All Nodes and groups are listed here, together with their absolute (Abs%) and relative (Rel%) heat map values, as well as the actual times (Time) required for the calculation. You can also read the internal identifier or Node path for each element in the fourth column. This is helpful because this path can be selected with the mouse, copied to the clipboard using Ctrl+C and then copied to the path search field. To do this, click on the bookmark icon in the header area of the Node Editor. An input window for the Node path opens. Path input for a Node
The display in the Node Editor therefore jumps exactly to the defined Node, even if it is used in lower Node levels, i.e., within groups. In addition, the corresponding Node is automatically selected, which makes it even easier to find in complex circuits.
Within the console, each entry in the Nodes group of the heat map output is followed by a number of keywords and boolean values(true or false): - isGroup: The values true (true) or false (false) indicate whether the entry is a group Node or a normal Node
- hidden: The function of a Node can be formed internally by other Nodes that the user cannot see in the Node Editor. If a listed Node is such a Node that is invisible to the user, true is displayed, otherwise false.
- convSrc: This value indicates whether or not data conversion is taking place at the corresponding Node. This always occurs when ports are connected that actually provide different data types, such as integer and bool. In these cases, the Node system calculates an automatic conversion, which, however, takes additional time. If possible, avoidable conversions should therefore be dispensed with in order to optimize a circuit. This mainly concerns the conversion of large amounts of data, as can occur when processing arrays, for example.
- Analysis
This area provides a summary of the number of Nodes in the circuit and the calculation time:- Timestamp: An internal time value is defined here at which the heat map was evaluated.
- Frames: This information refers to the time range in which the circuit was evaluated for the heat map. This time is output as the frame range of the scene, e.g., frame (0 to 1) for evaluating the time range between frame 0 and frame 1 of the timeline.
- User Nodes: The total number of Nodes created by the user for the circuit is displayed here. As Nodes can internally consist of (invisible) additional Nodes (see also hidden marking within the Node list), the actual number of Nodes to be calculated can be much larger than defined here.
- Executed User Nodes: This is the number of Nodes created by the user that were evaluated within the circuit to calculate the heat map. This number may be lower than defined for user Nodes, e.g., if there are Nodes marked in blue that only need to be billed once or have no connections.
- Total Nodes: This is the actual number of all Nodes to be calculated in the circuit. This includes the Nodes that are only used internally and are invisible to the user.
- Execution Time: This indicates the time required to calculate the entire circuit.
- Hottest Nodes
The Nodes and groups that account for the majority of the calculation time are listed here. As with the Nodes category, percentage relative and absolute values as well as the actual calculation times are also defined here. - Hottest Conversions
In this category you will find the Nodes and their ports on which the most complex data conversions have to be calculated. The preceding percentage values indicate absolute values for the complexity of the respective conversion calculation in relation to all conversions required in the circuit.
Output detailed heat map
The output of the heat map information in the Console can be even more detailed than described above. To do this, hold down the Shift key when calling up the Print heat map. The following illustration shows a possible result.
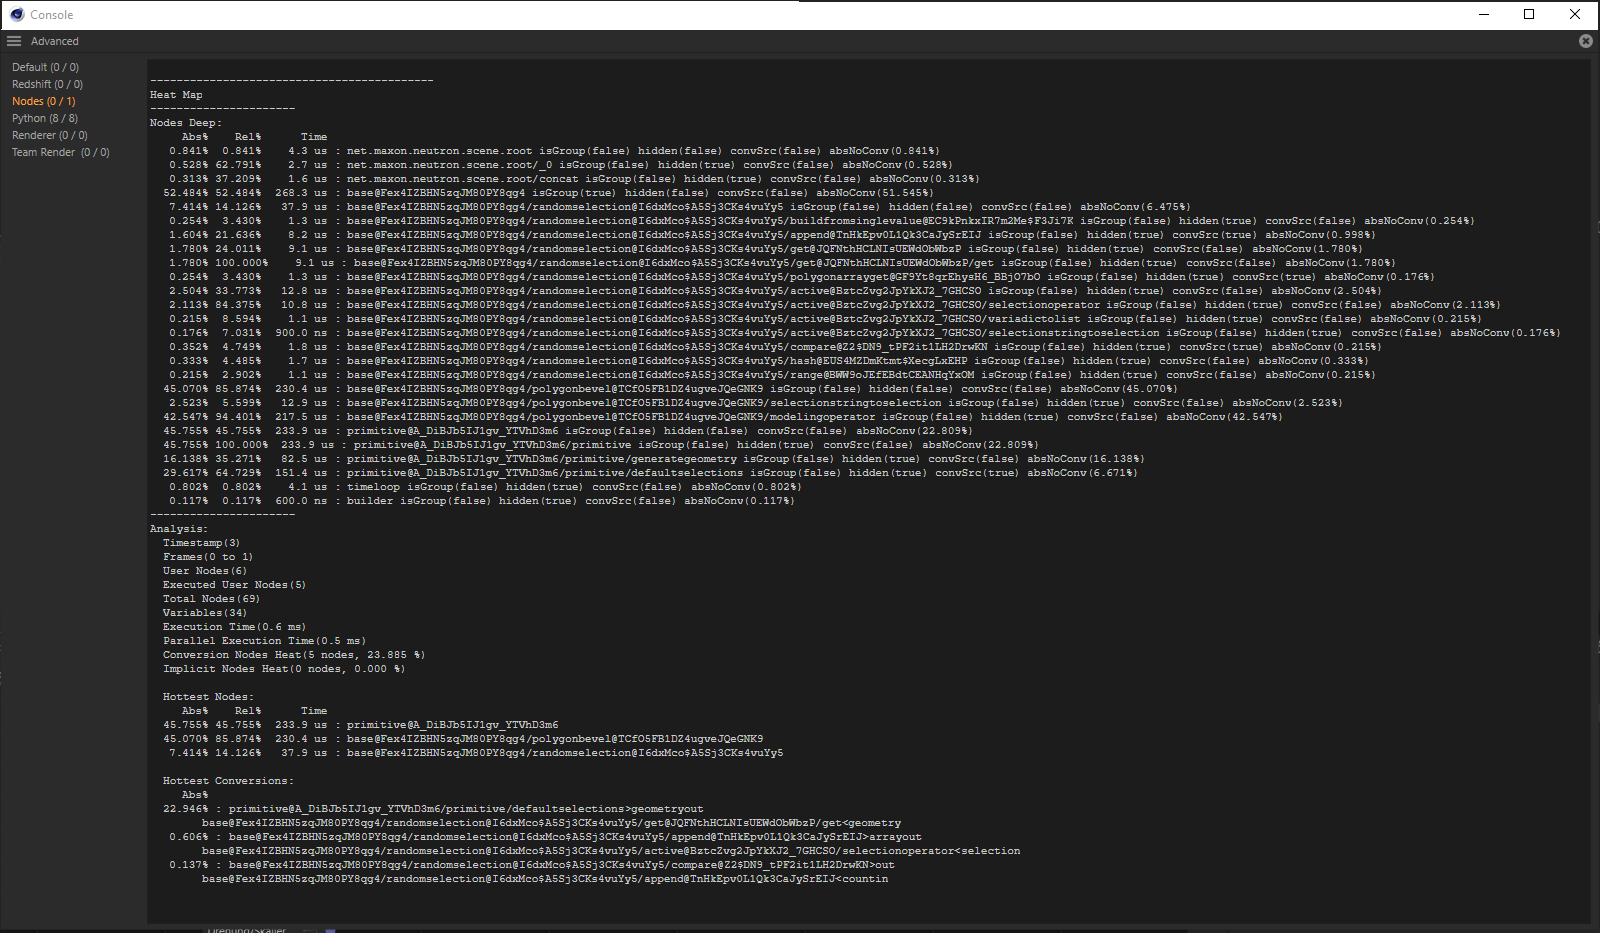 Detailed output of heat map data in the console.
The greater amount and presentation of information in the Nodes Deep category is particularly striking. Many of the Nodes that are otherwise kept hidden by the user now also appear here and can be recognized by the hidden (true) marker.
As additional information, the output of absNoConvis also availablefor all entries, from which you can read the absolute calculation time excluding data conversions at its ports. If the values for Abs% (first column of the list) and absNoConv are identical on a Node, no calculation time is lost for data conversions on the corresponding Node.
The Analysis section also provides additional information in detailed mode:
- Variables: This indicates the number of variables that are used by the Nodes within the circuit.
- Parallel Execution Time: The time span that could be calculated using threading and parallel data processing. If this time value is greater than defined for Execution Time, a correspondingly large number of sections of the circuit have been processed in parallel.
- Conversion Nodes Heat: The number of Nodes where conversions of data formats occur is displayed here. A second numerical value indicates the absolute proportion of this conversion in the overall calculation of the circuit.
- Implicit Nodes Heat: This refers to the Nodes that are automatically generated by the execution of the circuit and thus work hidden from the user, e.g., to execute iterations for arrays or to read parameters.
All other outputs of the detailed mode have already been described in the discussion of the standard mode here.