

Object Profiler
You are certainly familiar with the effect that large and complex scenes can become quite slow in terms of handling, navigation, animation, preparation time for rendering, etc. It is often difficult to recognize exactly where the bottleneck is: Which object or which tag is the one that requires the most calculation time (see also Why an Object Profiler?)
This task is now performed by the Object Profiler. It measures the calculation times of the individual objects and tags and displays them in a clear form. This allows you to recognize computing time-intensive elements at a glance.
This can look like this, for example:
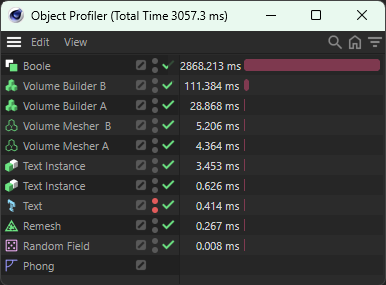
In the example above, you can see at first glance who the culprit is here: the Boole object consumes the most computing time by a wide margin.
At the top of the window title you can see the total computing time (here 3057.3 milliseconds ≈ 3 seconds). In the window itself - which is a simplified Object Manager - all objects and tags are listed together with their respective calculation times. The elements are sorted according to the calculation time. Above you will find the most time-consuming ones. Elements can be deactivated or reactivated with the green tick or the red cross.
Why an Object Profiler?
In many places, it is important - or at least informative - to know what the precious computing time is being spent on. Of course it is nice and satisfying, for example, to have built a fully parametric scene that only requires 400 kB of memory on the hard disk, but creates an extremely complex object in the view. However, if the frame rate in the view collapses to 1 frame per second and the navigation can only be compared to a slide show, then this is simply impractical. The Object Profiler can help to identify the biggest time wasters and, for example
- to deactivate.
- (e.g., particle or Rigid Body simulations).
- to add easier, faster to calculate settings.
- by creating a different workflow.
- convert to a polygon object, etc.
Important to know
- The Object Profiler does not measure processes that run on the graphics card/GPU (e.g., simulations) or happen during rendering. In addition, some deformers and a number of tags are not measured (e.g., hair tags, phong tags etc., generally all tags that do not really need to be calculated).
- As long as the Object Profiler is open, it measures. As it consumes relatively few resources, it should not have a noticeable negative effect on scene performance.
- Do not take all the values shown here at face value: Cinema 4D does not constantly recalculate everything internally! If, for example, you imagine an Extrude object that creates polygons from a spline by means of displacement, then the polygon mesh created is saved and stored internally in a cache. And for as long as possible. This means that the computing time for generating the Extrude object is only used when loading the scene, for example, while hardly any further computing time is required for a measurement in Figure 15 (unless you change the spline there, for example, and thus trigger a recalculation). Internal caching of objects happens in countless places in Cinema 4D. When exactly these internal caches are then updated - i.e., recalculated - is largely opaque to the user. For this reason, the Object Profiler cannot correctly reflect the actual - i.e., maximum - calculation time for each element at all times! However, you can use the various Profile modes in the View menu to influence this, e.g., by running the animation and the Object Profiler only ever displaying the maximum value measured up to that point.
- As the Object Profiler offers a simplified Object Manager view, it is not described in detail in this regard. Details on the Object Manager can be found here.
Object profiler commands and settings
Only the commands and settings that are not available in the Object Manager are covered here. Everything else works in the same way.
View Menu
The measured values can also be displayed directly in the Object Manager if you activate this option. However, these are only visible there if the Object Profiler is open at the same time!
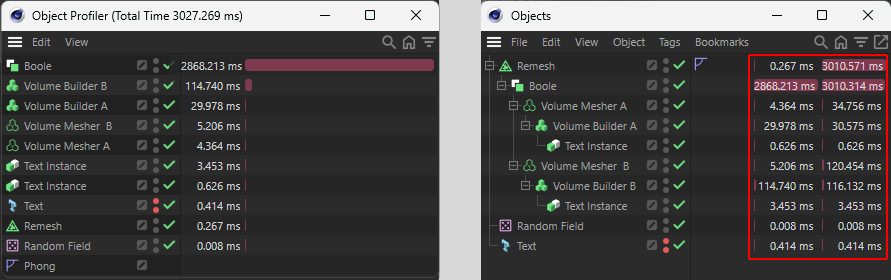
Well, but why do you see 2 columns in the Object Manager? Put simply, these have the following meaning:
- The left-hand column shows the measurements for the object including its tags.
- the right-hand column shows the measurements for the object including its Child objects/tags. In addition, the time that the object may spend in other objects is also included. What is meant by this? Imagine a Cloner object that is affected by the Python effector. The Python effector calculation time is then also included in the Cloner object itself.
Profile mode
The Profile mode is perhaps the most important parameter set here in the Object Profiler. Try to understand these 4 settings as well as possible so that you know what the Object Profiler is actually measuring. We need to go a little further into this.
Even a simple click in the Object Manager causes Cinema 4D to calculate a scene for all objects (scene execution). This would of course be an exaggeration for unchanged, already calculated objects: If no new input parameters have been entered (whether manually or animated), nothing actually needs to be recalculated. And this does not happen, because such objects normally know whether they need to be recalculated or not and pass this on to Cinema 4D - the object is then retrieved from the already calculated cache. However, and here comes the big but, the Object Profiler does not know whether the measured object time now applies to the mere checking of an unchanged object or its complete recalculation. That is why there are these four modes described below.
Example
Load the following scene once and open the Object Profiler ().

Activate the Last Execution option in the menu under .
A series of generators work in the scene to create a kind of jagged corona from a circular spline: A Displacer deformer turns a circular spline into a jagged one, which creates a polygon mesh with the help of a Sweep object. A Volume generator converts this polygon mesh into voxels, smoothes them slightly and a volume mesher finally generates the target mesh.
This means that a series of computationally complex processes are carried out one after the other.
Now click several times in an empty area of the Object Manager - or Object Profiler - and observe the measured times in the Object Profiler (illustration on the left).
Then press button A several times (illustration on the right). The following times result on a mid-range PC (2024):
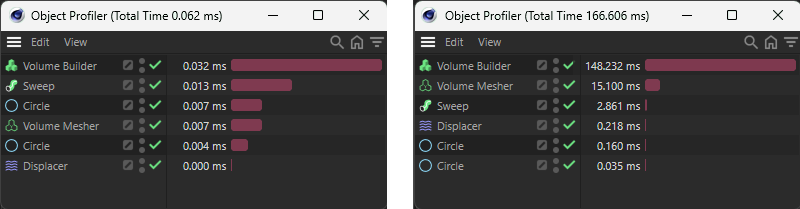
The times are dramatically different here. Why is that?
When you click in the Manager, a scene is executed taking into account all caches and computing time-saving measures. This happens very quickly. In the second case (button A = redraw), a complete scene execution is initiated, whereby each object is recalculated. This happens automatically, for example, when you load a scene; Cinema 4D cannot yet access any caches (unless you have explicitly saved them beforehand), but has to calculate everything first.
This is just to illustrate how dramatically different measured times can be.
In this mode, the duration of the last scene execution is displayed. And this is done virtually in real time, i.e., when you click somewhere with the mouse or simply move over the scene in the view, or whenever Cinema 4D executes a new scene, this is displayed directly. This means that the values here may change constantly and the one measurement that is important for you may be lost. See also the example where this mode is used.
This mode applies per (animation) frame. Of the possibly numerous scene executions that occur per frame, only the result with the longest calculation time is displayed; slower ones are overwritten directly. If you change the (animation) frame, the previous maximum time is deleted and the process starts again from the beginning.
The problem here is that you change the Voxel Size of a Volume generator, for example, to test how this affects the calculation time. In Current Frame mode, no shorter time would be displayed. To do this, switch to the next mode:
Works in a similar way to Current Frame, except that each time you make a change to an object or day, the measurement is repeated. This means that you should use this mode if you want to study the influence of parameter changes, as - in contrast to the previous option - decreasing times are then also displayed.
Ultimately, this mode is about discovering time wasters across an entire animation. Let the animation run through completely (see also Tip below).
The maximum element calculation times per screen are continuously determined (i.e., as Current Frame does for the current point in time), whereby the Object Profiler only ever displays the maximum determined up to this point in time. If the animation starts again, the maximum displayed is also reset.
Imagine that a previously deactivated remesher is switched on by animation in Figure 67. Of course, its calculation time is not displayed in screens 0-66. It is therefore necessary to measure the entire animation so that everything can be taken into account.
- Set the playback mode (e.g., in the ) to
 Simple so that the animation stops in the last frame; if the animation starts from the beginning, times that have already been measured will be deleted.
 - Set the frame rate (e.g., in the ) to
 All Frames so that no animation frames are skipped and their measurement results are missing in the Object Profiler.
Unit
Define the way in which the time measurements are to be displayed here.
The times are displayed in ms (milliseconds = thousandths of a second).
The individual elements are always displayed here as a percentage of the total measuring time
Here, the times are displayed either in ms (milliseconds = thousandths of a second) or µs (microseconds = millionths of a second). If the display in µs has four digits, it automatically switches to ms.